

Example of 1-Variable Statistics
The following example shows you how to apply the information given in the previous sections concerning 1-variable data. The example is divided into two parts. Part one shows you how to enter and remove the data. Part two shows you how to perform calculations and review the data.
Example - Part One
Enter the data values listed below. (Be sure to remove any values that are entered incorrectly.)75 86 93 93 93 93 98 100
Procedure | Press | Display |
|---|---|---|
| Clear display | [ CLEAR ] |  |
| Clear registers and select 1-variable | [ STAT ]{ CLR }{ CS1 } |  |
| Begin data entry | 75 [ ∑+ ] | 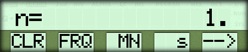 |
| Enter incorrect value for later removal | 85 [ ∑+ ] |  |
| Enter correct value | 86 [ ∑+ ] | 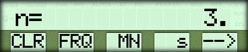 |
| Enter incorrect repeated values | 4 { FRQ } 94 [ ∑+ ] |  |
| Remove values | [ INV ][ ∑+ ] | 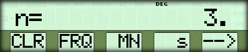 |
| Enter repeated values correctly | 4 { FRQ } 93 [ ∑+ ] | 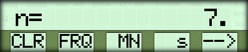 |
| Enter remaining data | 98 [ ∑+ ] |  |
| 100 [ ∑+ ] | 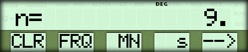 | |
| Remove earlier incorrect value | 85 [ INV ] [ ∑+ ] | 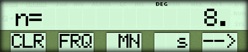 |
Example - Part Two
Calculate the mean, population standard deviation, sum, and sum of the squares of the data entered in part one above. Then check the last data value entered, and the frequency of the last data entered.Procedure | Press | Display |
|---|---|---|
| Mean | { MN } | 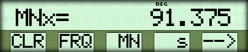 |
| Population standard deviation | [ INV ]{ s } | 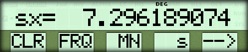 |
| Select show option | { --> }{ SHW } | 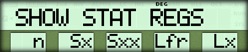 |
| Sum | { Sx } | 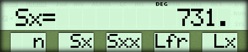 |
| Sum of squares | { Sxx } | 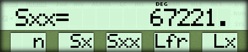 |
| Number of data values | { n } | 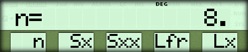 |
| Last entered value | { Lx } | 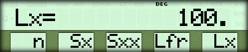 |
| Last entered frequency | { Lfr } | 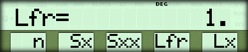 |
☚ Back